Product Update: Indicator Backfills
One of our guiding principles at Lariat Data is to provide a data quality monitoring platform that accounts for the messiness and unpredictability of real-world data pipelines. We are happy to announce that Lariat now allows users to schedule backfills for Indicator data. With Indicator Backfills, users can ensure that historical Indicator data properly reflects any retroactive corrections made to a backing data source.
Robust pipeline designs often include a mode for backfilling, or remediating the data produced by a pipeline, at some time after its initial completion. This is a first-order concern for data teams, as they look to ensure reliable data outputs in the face of broken input data, infrastructure failures, and buggy code. Indicator Backfills are intended as a natural final step in the data remediation process, ensuring that health metric calculations in Lariat are fully reconciled with the new, post-backfill source of truth.
A common use-case for Lariat Indicators is to express diagnostic queries against the data that lives within a data warehouse. These queries may be used to determine freshness, completeness, and usability of the data, among other things.
Example: Below is an Indicator tracking the number of visits to a fictional media site, expressed as a count of new rows in a Snowflake table user_visits. The count is windowed using the created timestamp , and runs hourly.


It can be useful to track a measurement like this for a few reasons:
An analytics team wants to pull a report on recent geographical distribution of site visitors, and they may look at this graph to confirm that the Snowflake data they are working with is complete, before running their report.
A data engineer who is working on the job that filters out bot visits before feeding data to user_visits may use this graph to validate that their pipeline is outputting data at the regular cadence.
In both cases, the Indicator is functioning as a sort of projection of the data itself, one that can communicate the readiness of the data, at a glance, without consumers needing to inspect the table by hand.
Lariat has flagged a degradation to this Indicator in the graph above. On investigation, it is revealed that a bug in the job that writes data to user_visits has caused several legitimate visitors to be classified as bots for a period of time.
The responding data engineer fixes the bug, and subsequently kicks off a backfill process to “fill in” the missing user_visits rows for the time window 07/17 00:00 to 07/17 12:00. Using Indicator Backfills, the engineer can now also instruct Lariat to reconcile measurements for the same time period with the new source-of-truth in Snowflake.

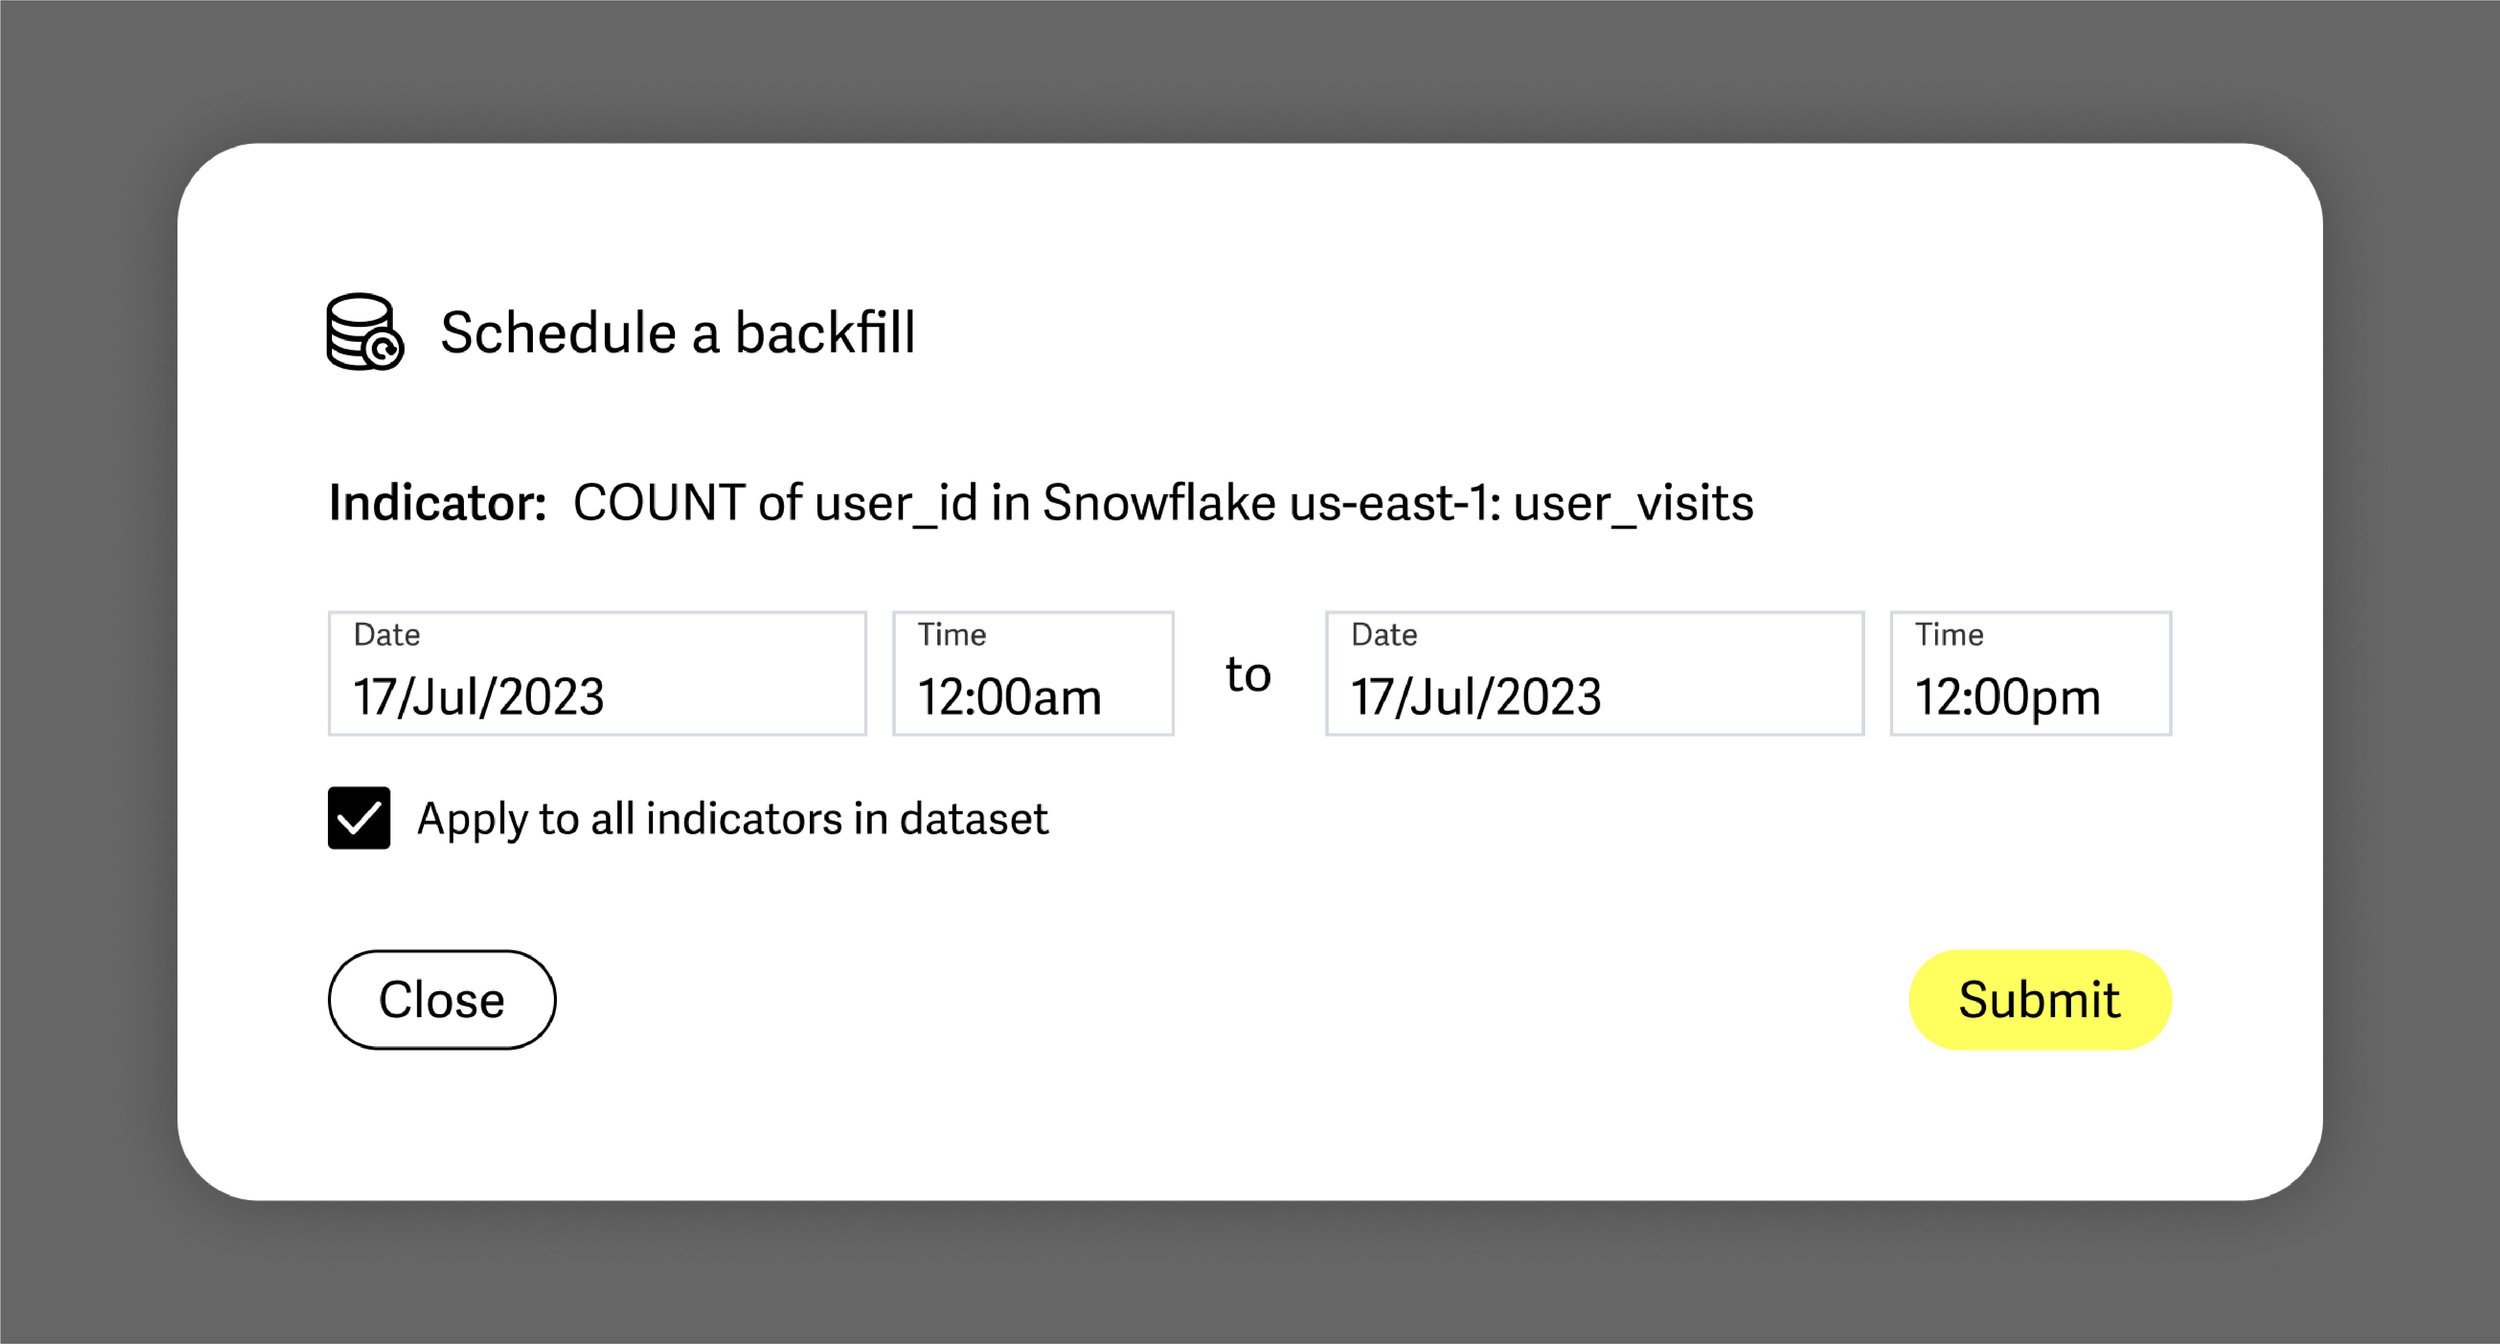
Since such bugs tend to present themselves at the dataset or table-level, users also have the option to schedule backfills for any other Indicator in their account that is defined on the same dataset, in this case the user_visits table in Snowflake.
Once the Indicator is backfilled, the data team can confirm the success of their backfill procedure by-revisiting the Indicator graph and ensuring that the dip they originally saw is no longer present.

Now other stakeholders, like the analytics team, have an up-to-date view on the readiness of the user_visits table, rather than a view that has fallen out of sync with the present state of the data.
This is a valuable feedback loop for data teams. They can use Lariat both to detect the incidence of a data issue in a window of time, as well as to confirm the success of their make-good procedures. To do so, they would schedule an Indicator Backfill for the same window of time they are backfilling in the source data, and Lariat will take care of scheduling the diagnostic queries and rewriting the timeseries data.

Backfill requests are scheduled off-cycle from the computation of Indicators for present time windows, and so you can expect live data to continue to flow through even as Indicator backfills are in progress.
Indicator Backfills are generally available for all Lariat users. If you haven’t tried us out, you can be up and running with our Continuous Data Quality monitoring platform in minutes! Check us out here.